Business Intelligence
The business-intelligence page: the top tiles, the revenue chart and the metrics table.
The Business Intelligence page shows the clinic's key figures. Below the tiles are the revenue chart and a metrics table.
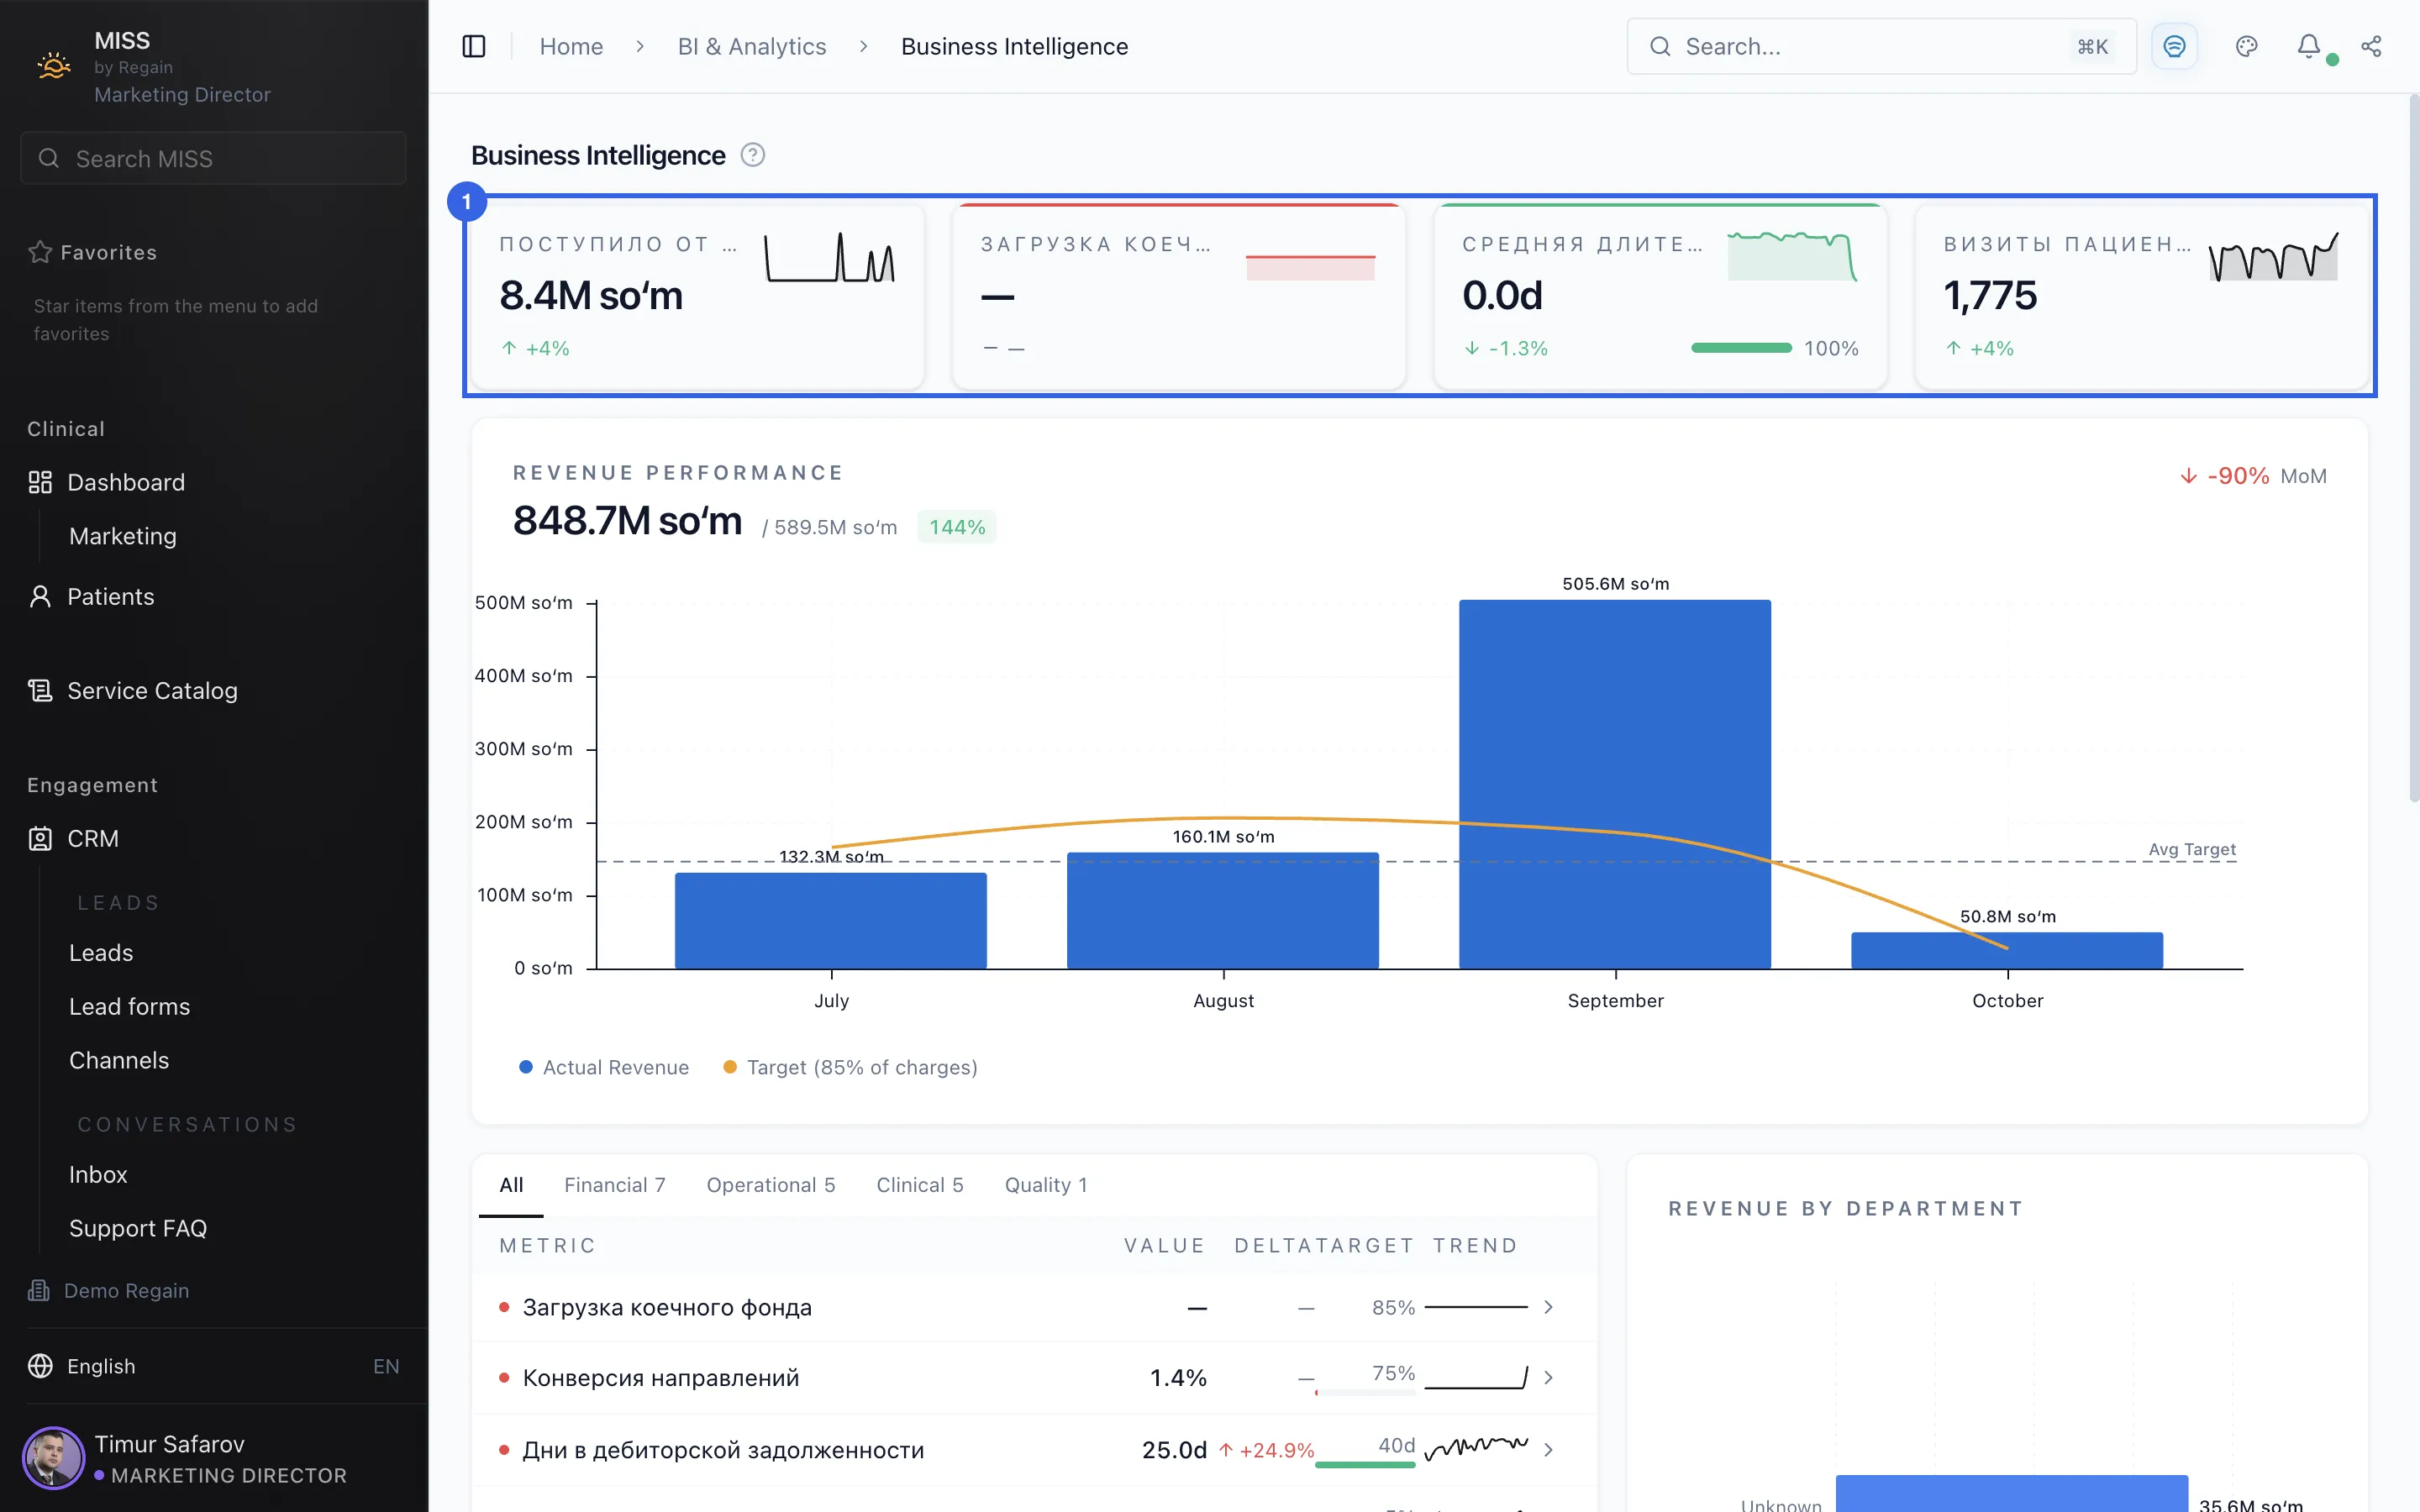
- Each tile in the top row has a title, a value or a dash, a small line chart and, on most, a per cent with an arrow.
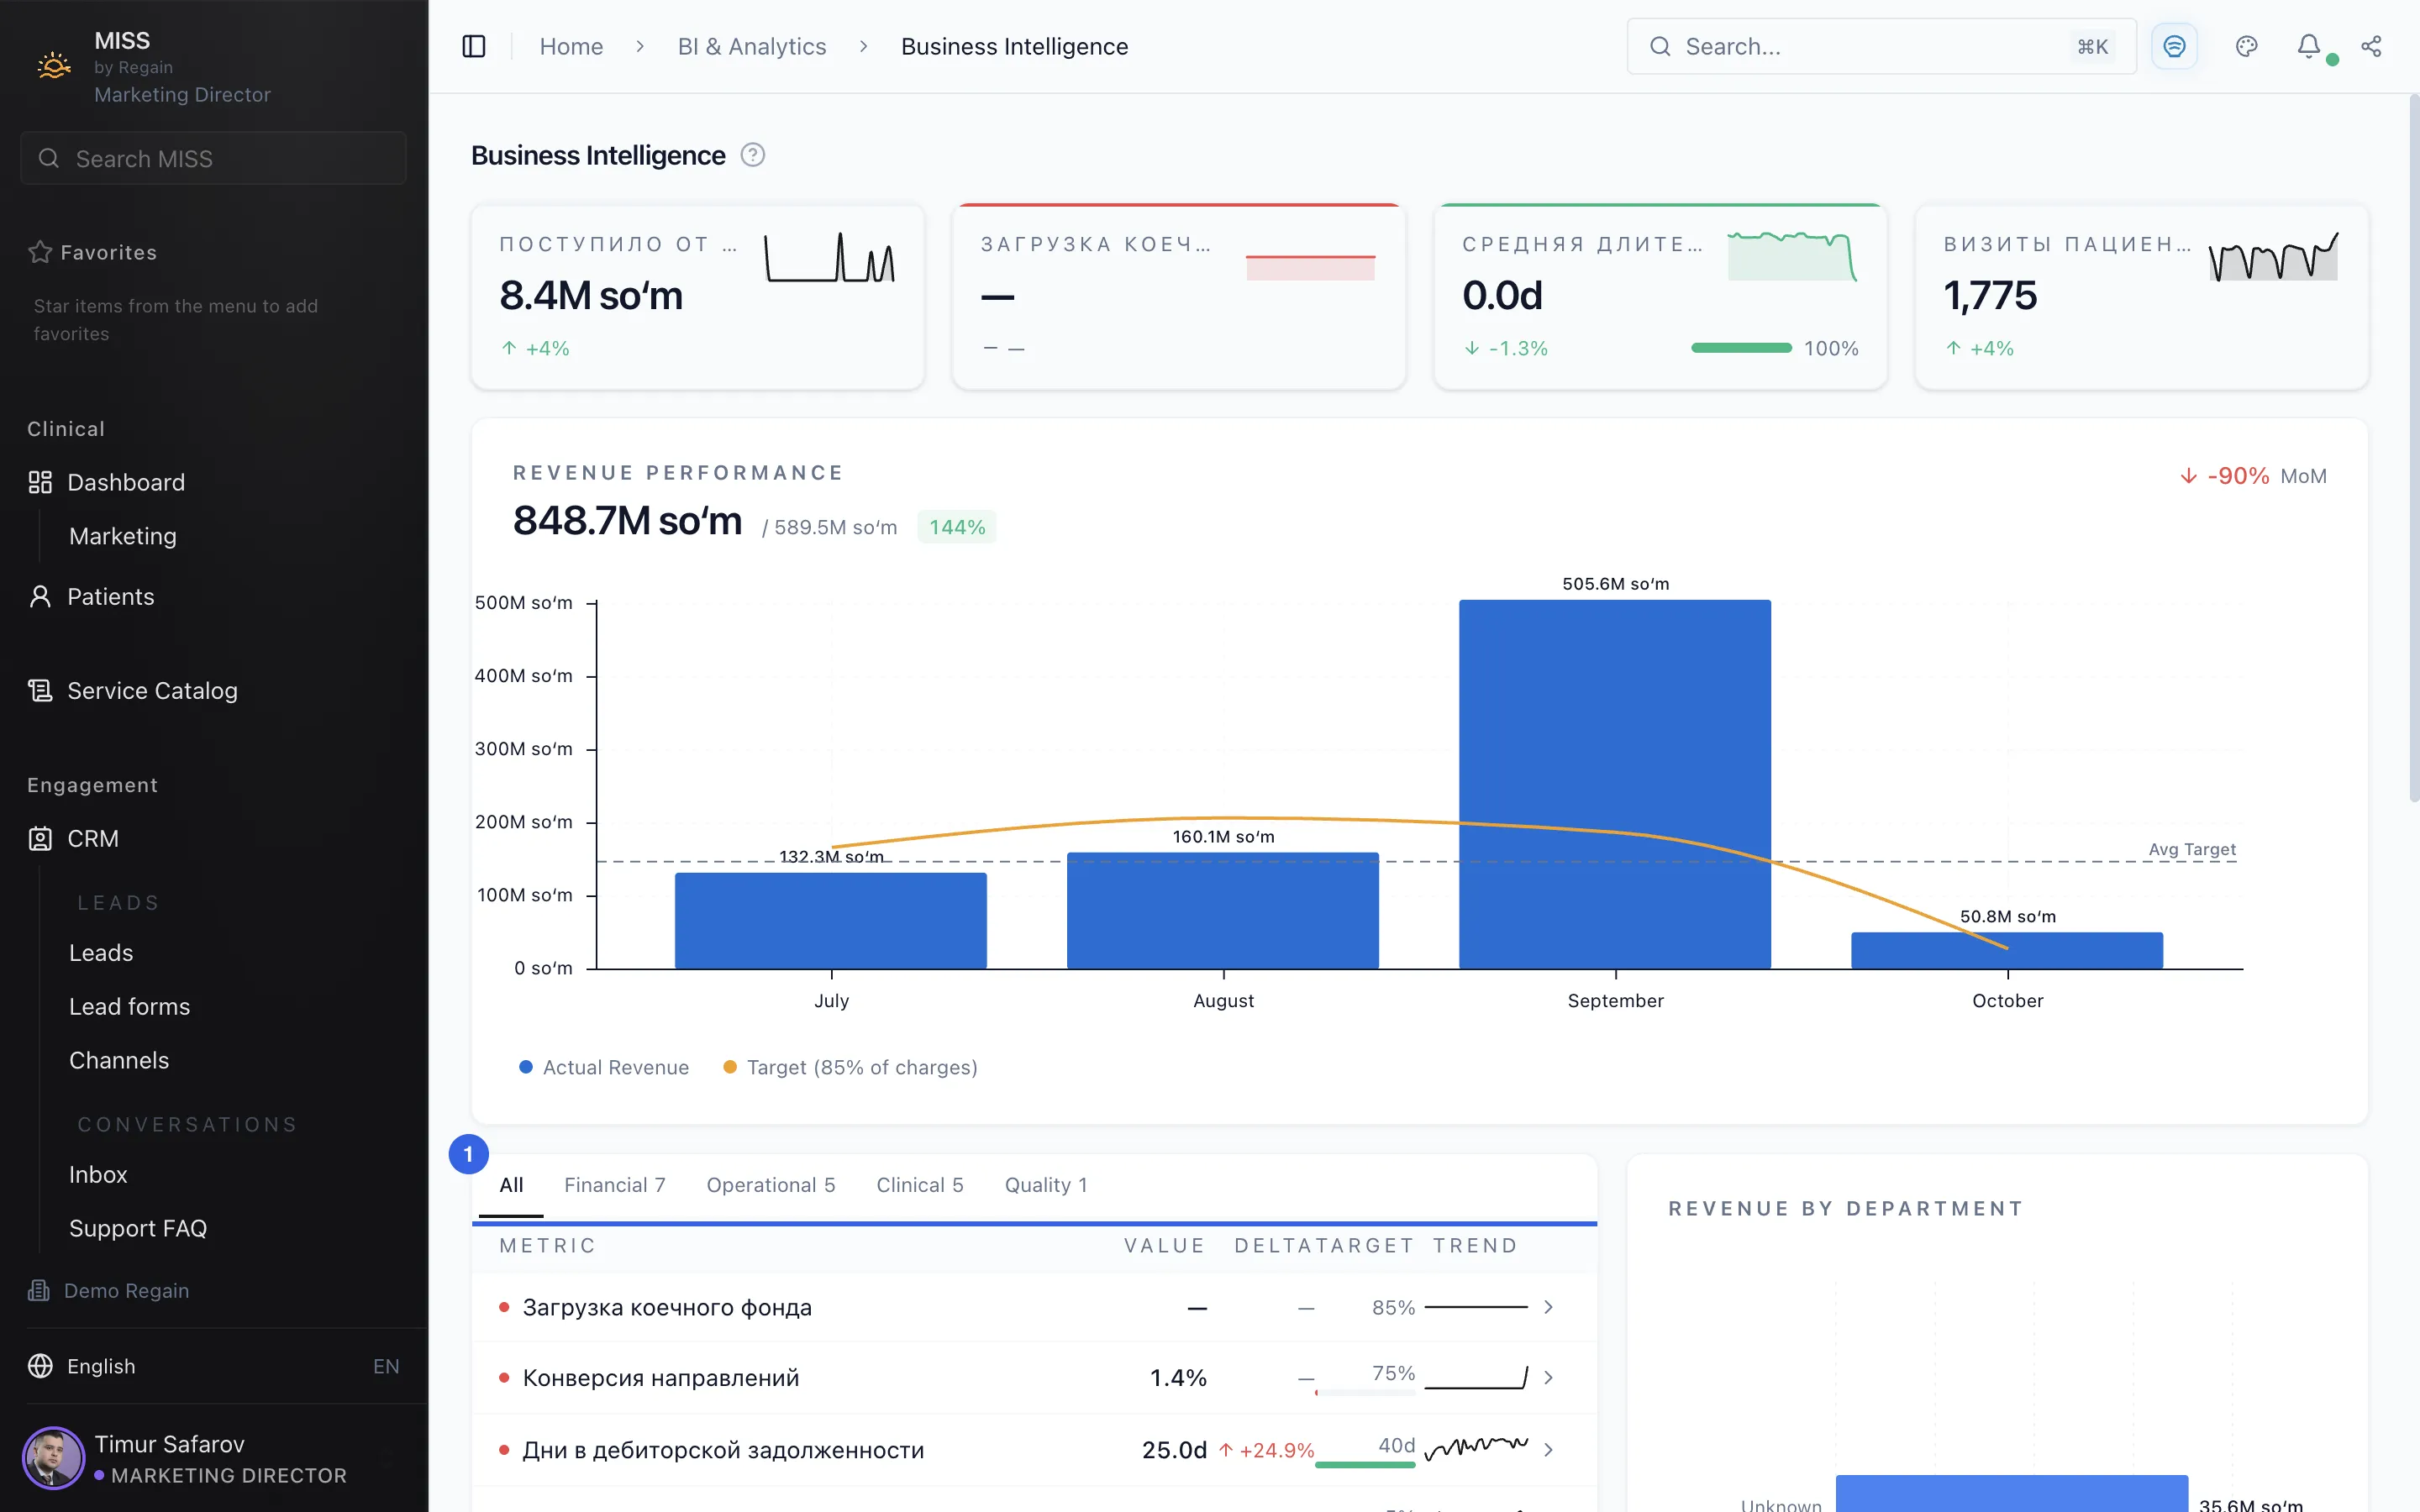
1 - Above the metrics table are the tabs All, Financial, Operational, Clinical and Quality, four of them with a number. The table lists metrics with their value, target and trend.
2
Screenshots captured on 2026-10-03