Revenue Cycle
Read the revenue-cycle dashboard: the four key rates, the period and the tabs of the module.
The Revenue Cycle page opens on its Dashboard tab.
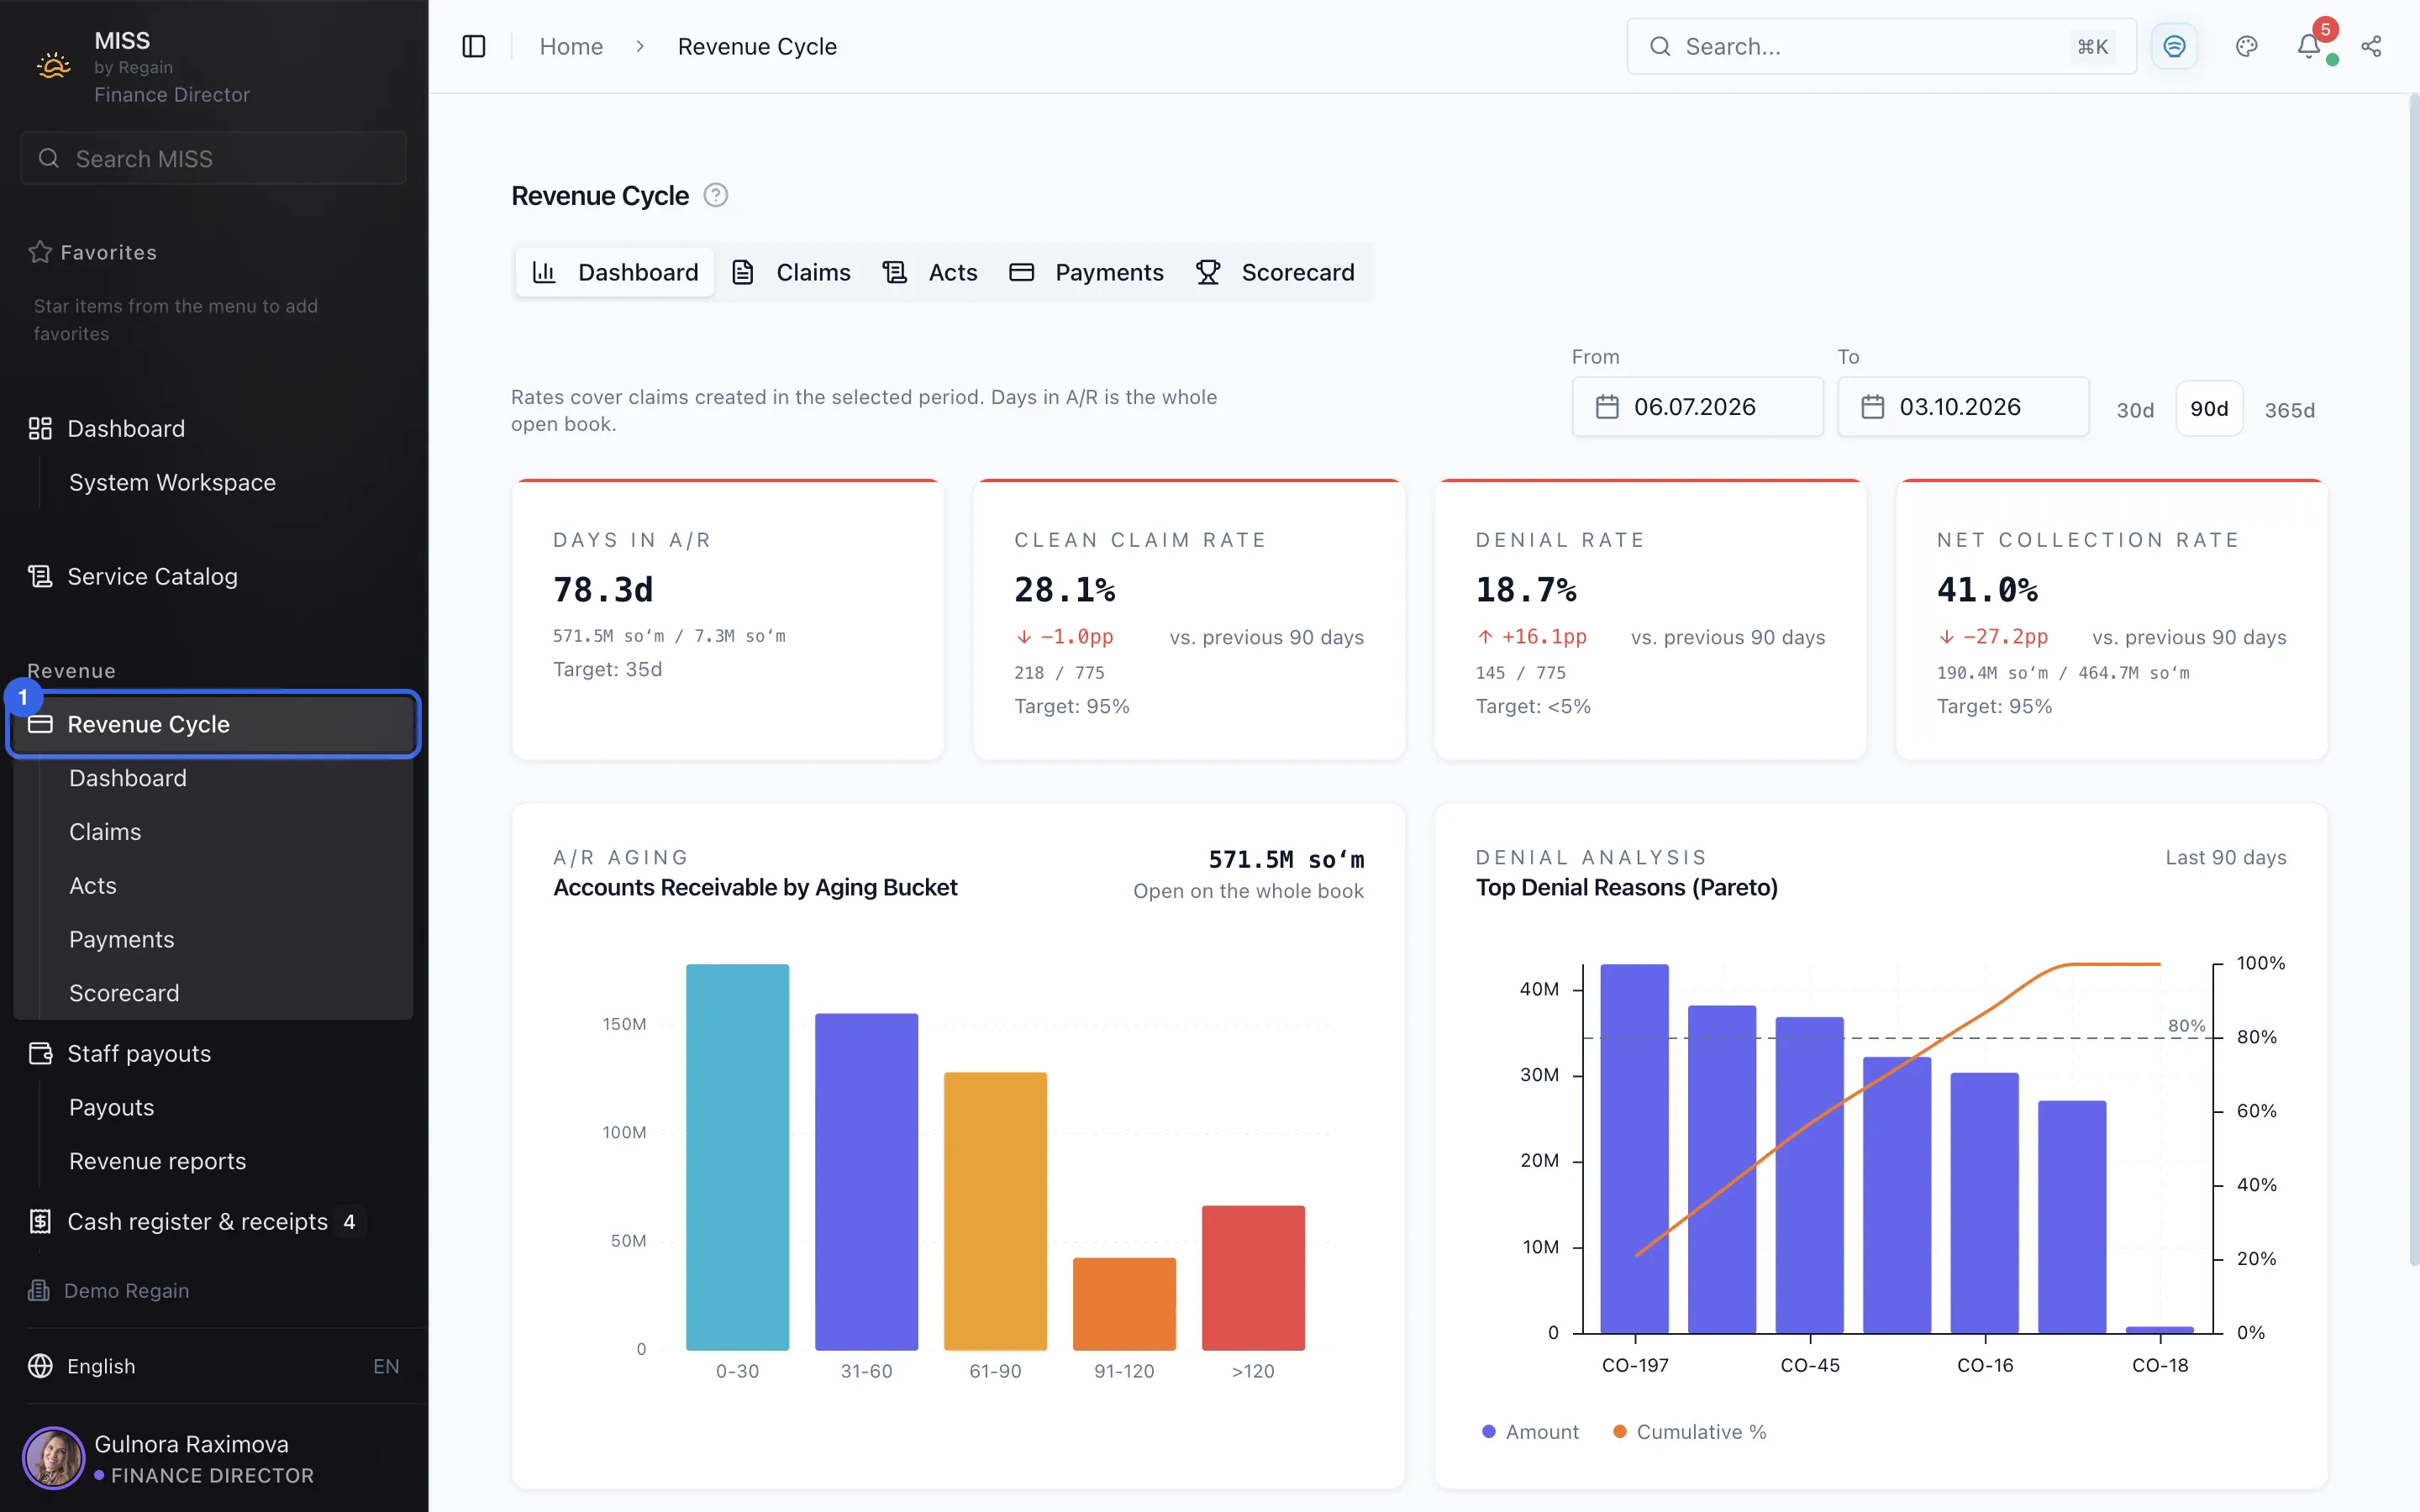
- In the side menu, open Revenue Cycle. The pages of the module are listed under it.
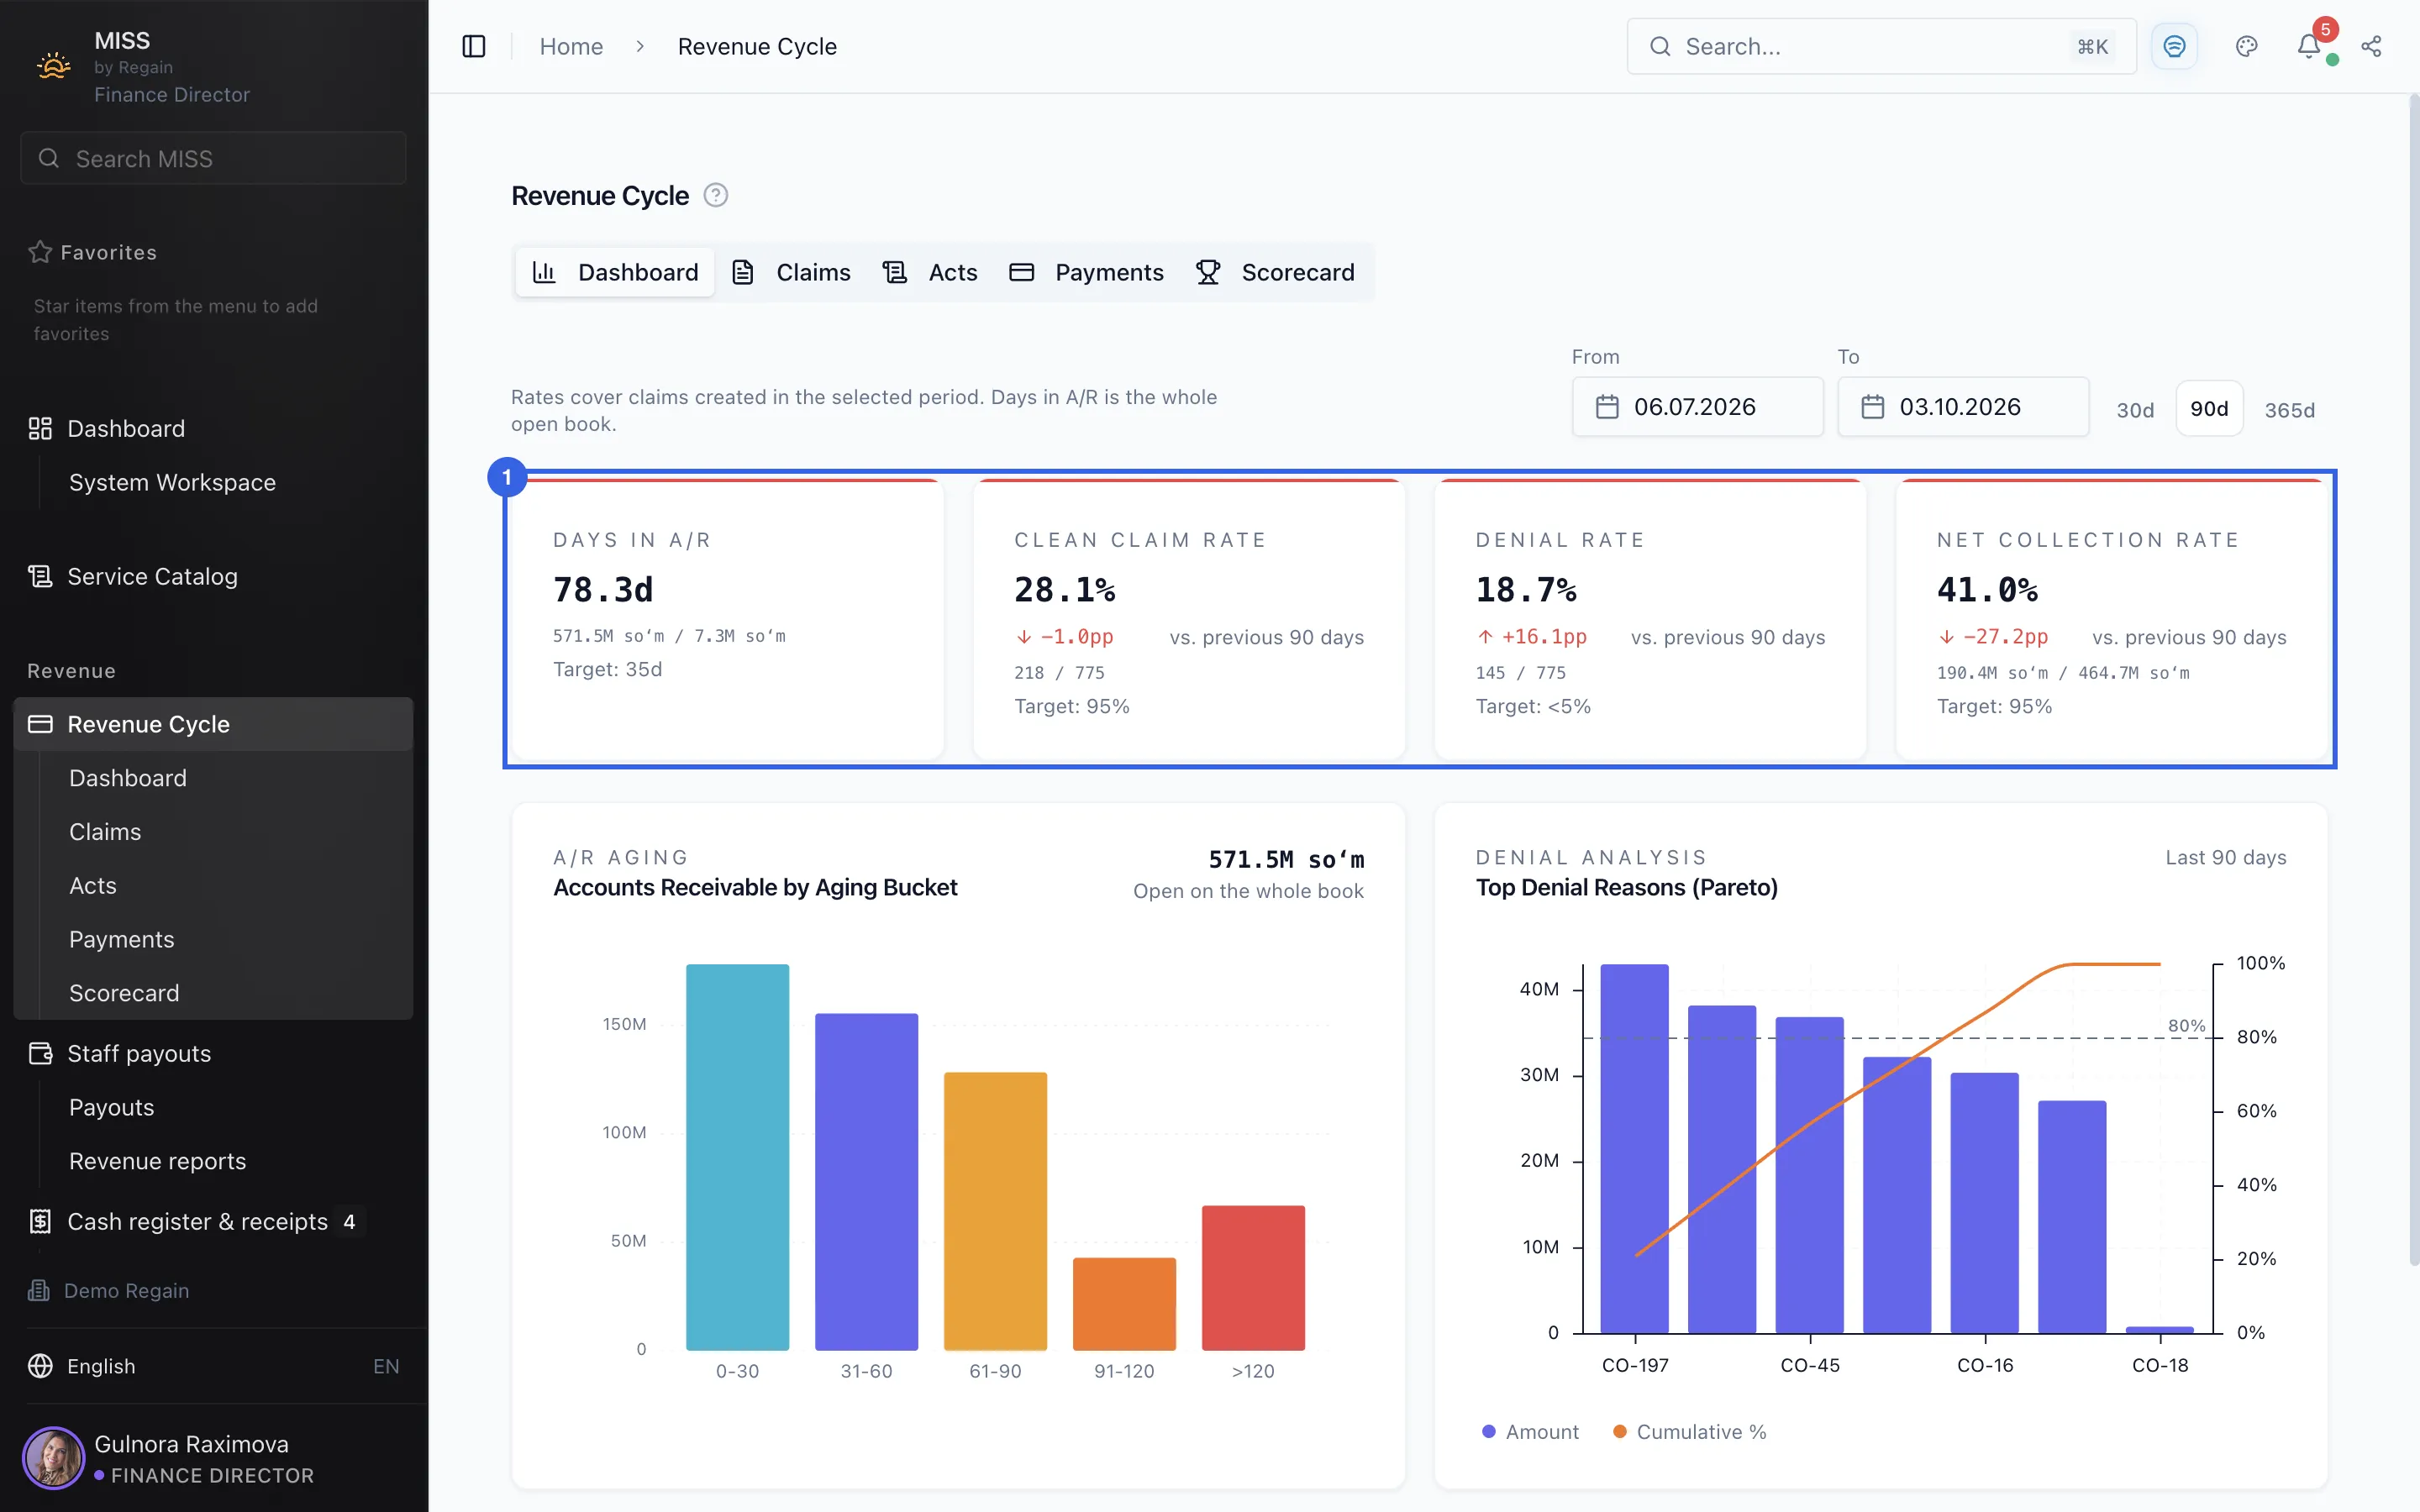
1 - The tiles show four figures: Days in A/R, Clean claim rate, Denial rate and Net collection rate. The note above them says the rates cover claims created in the selected period, and that Days in A/R covers the whole open book.
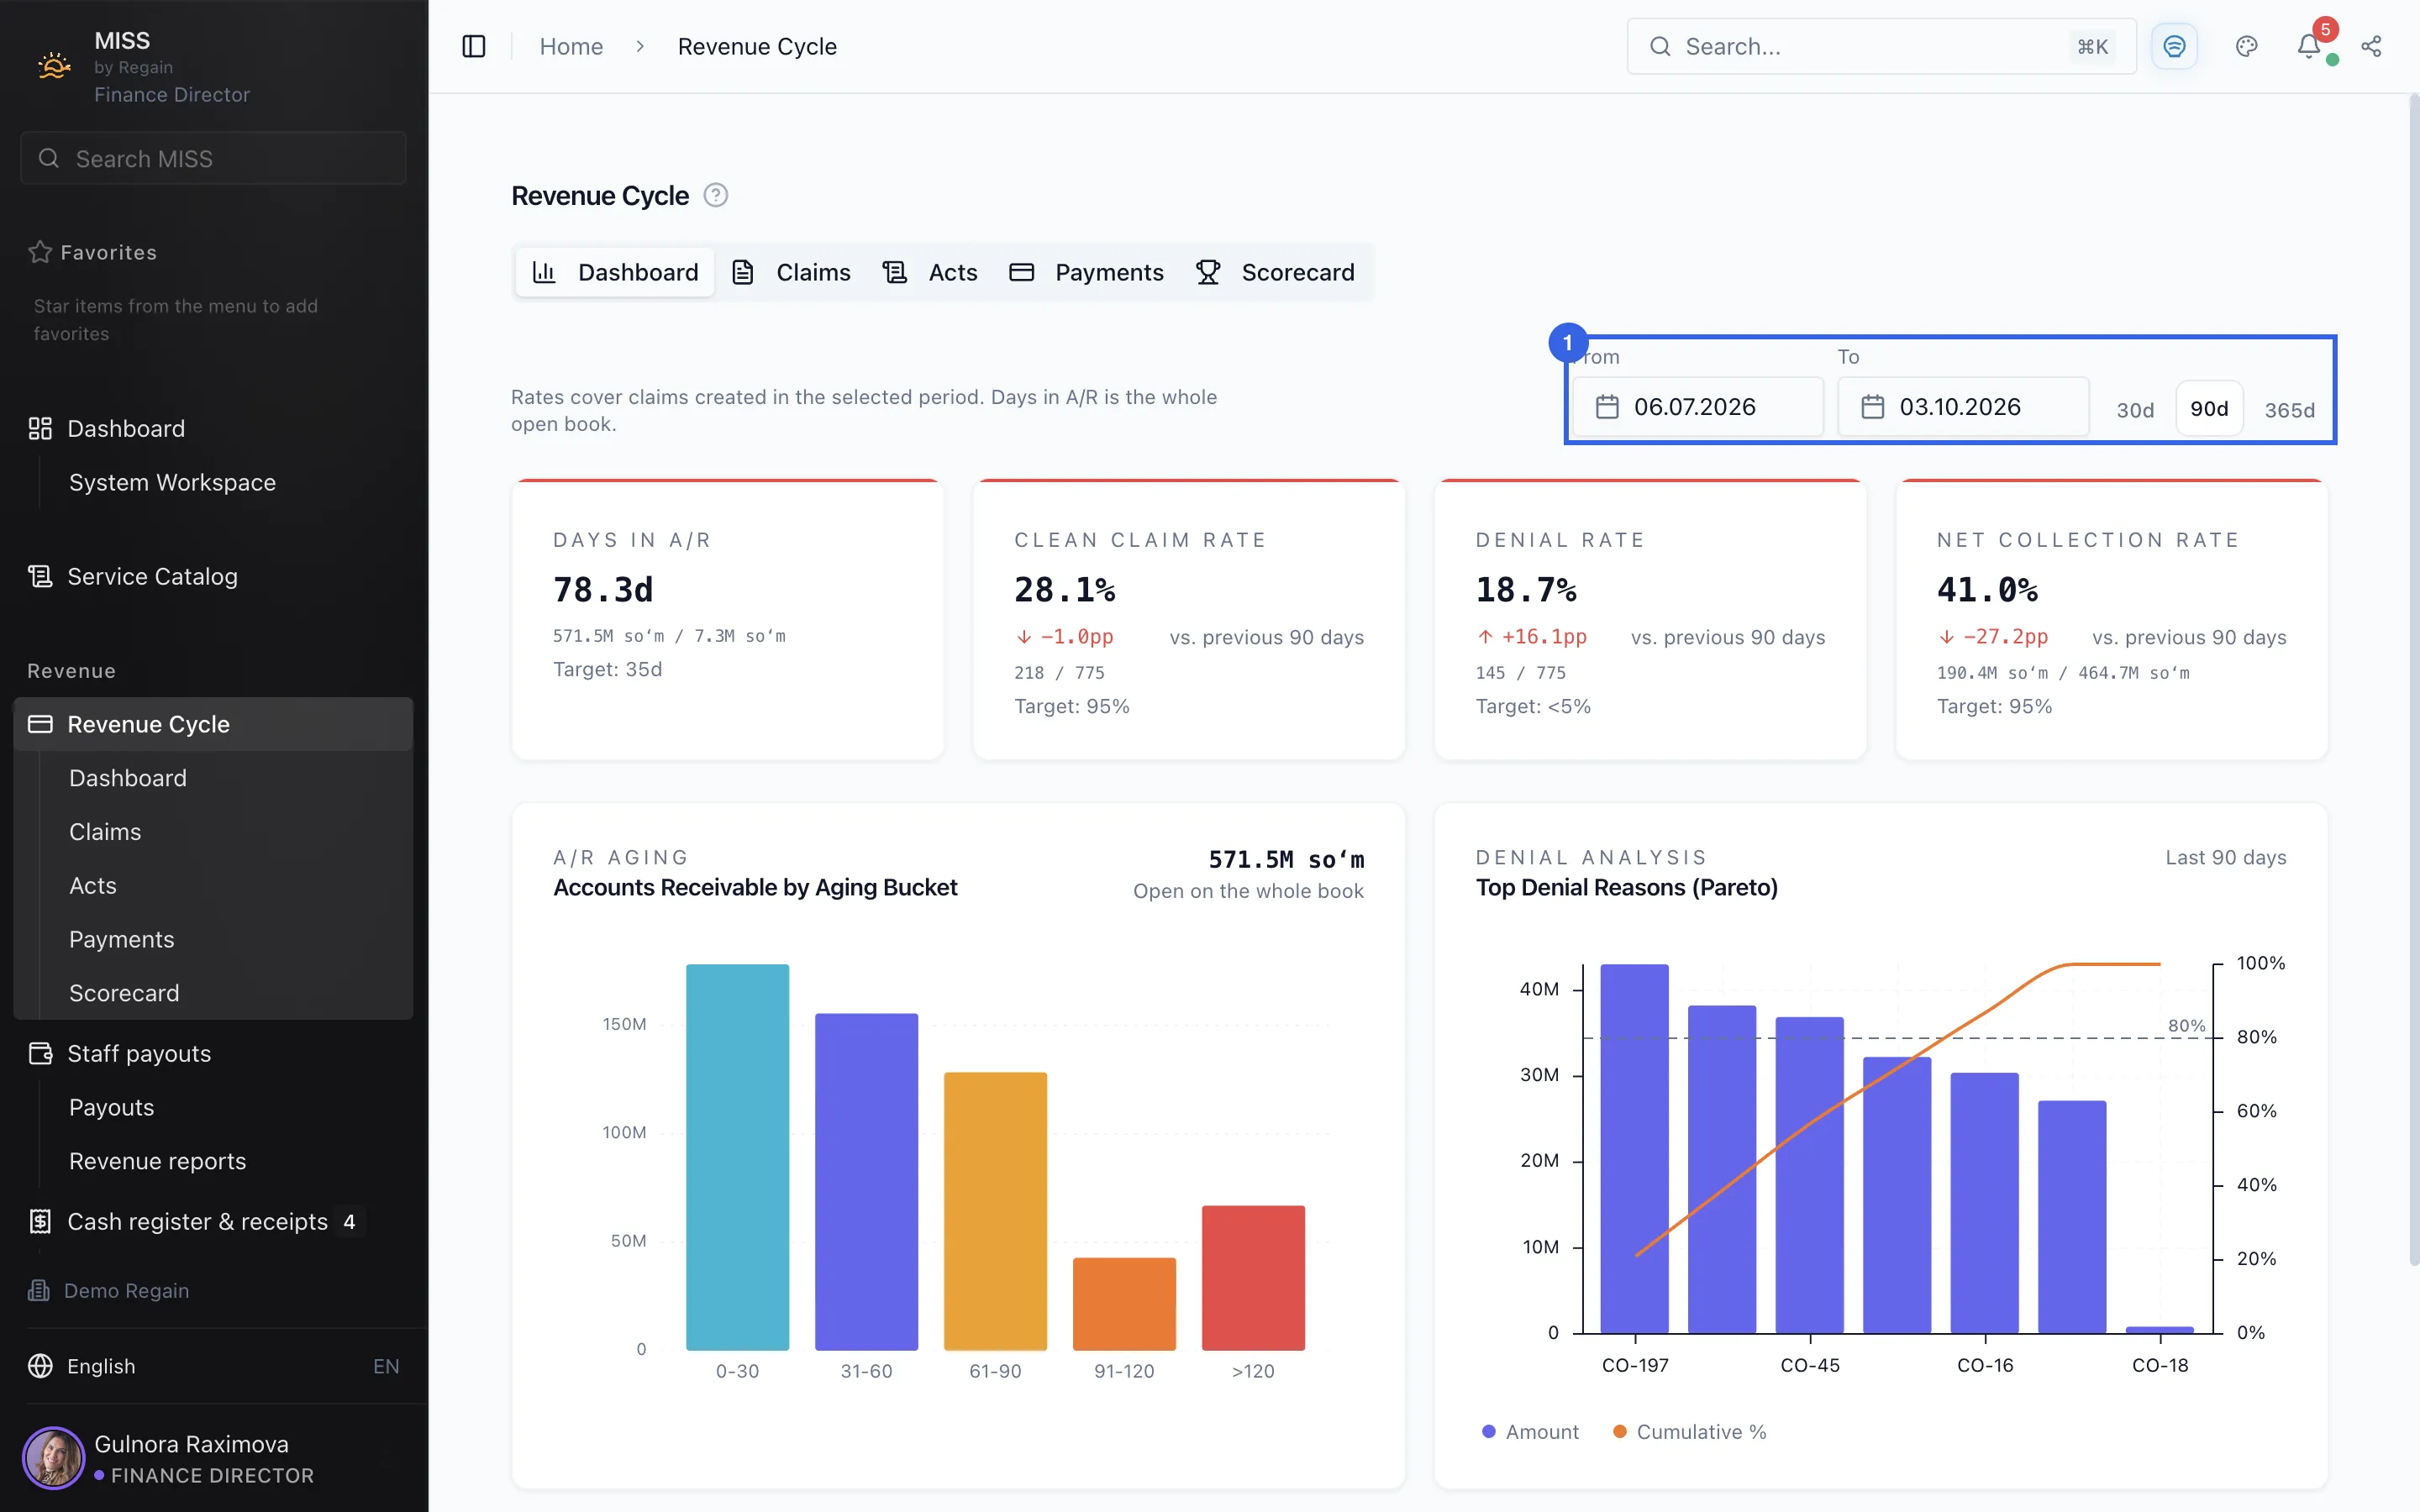
2 - Next to the From and To dates are the 30d, 90d and 365d buttons.
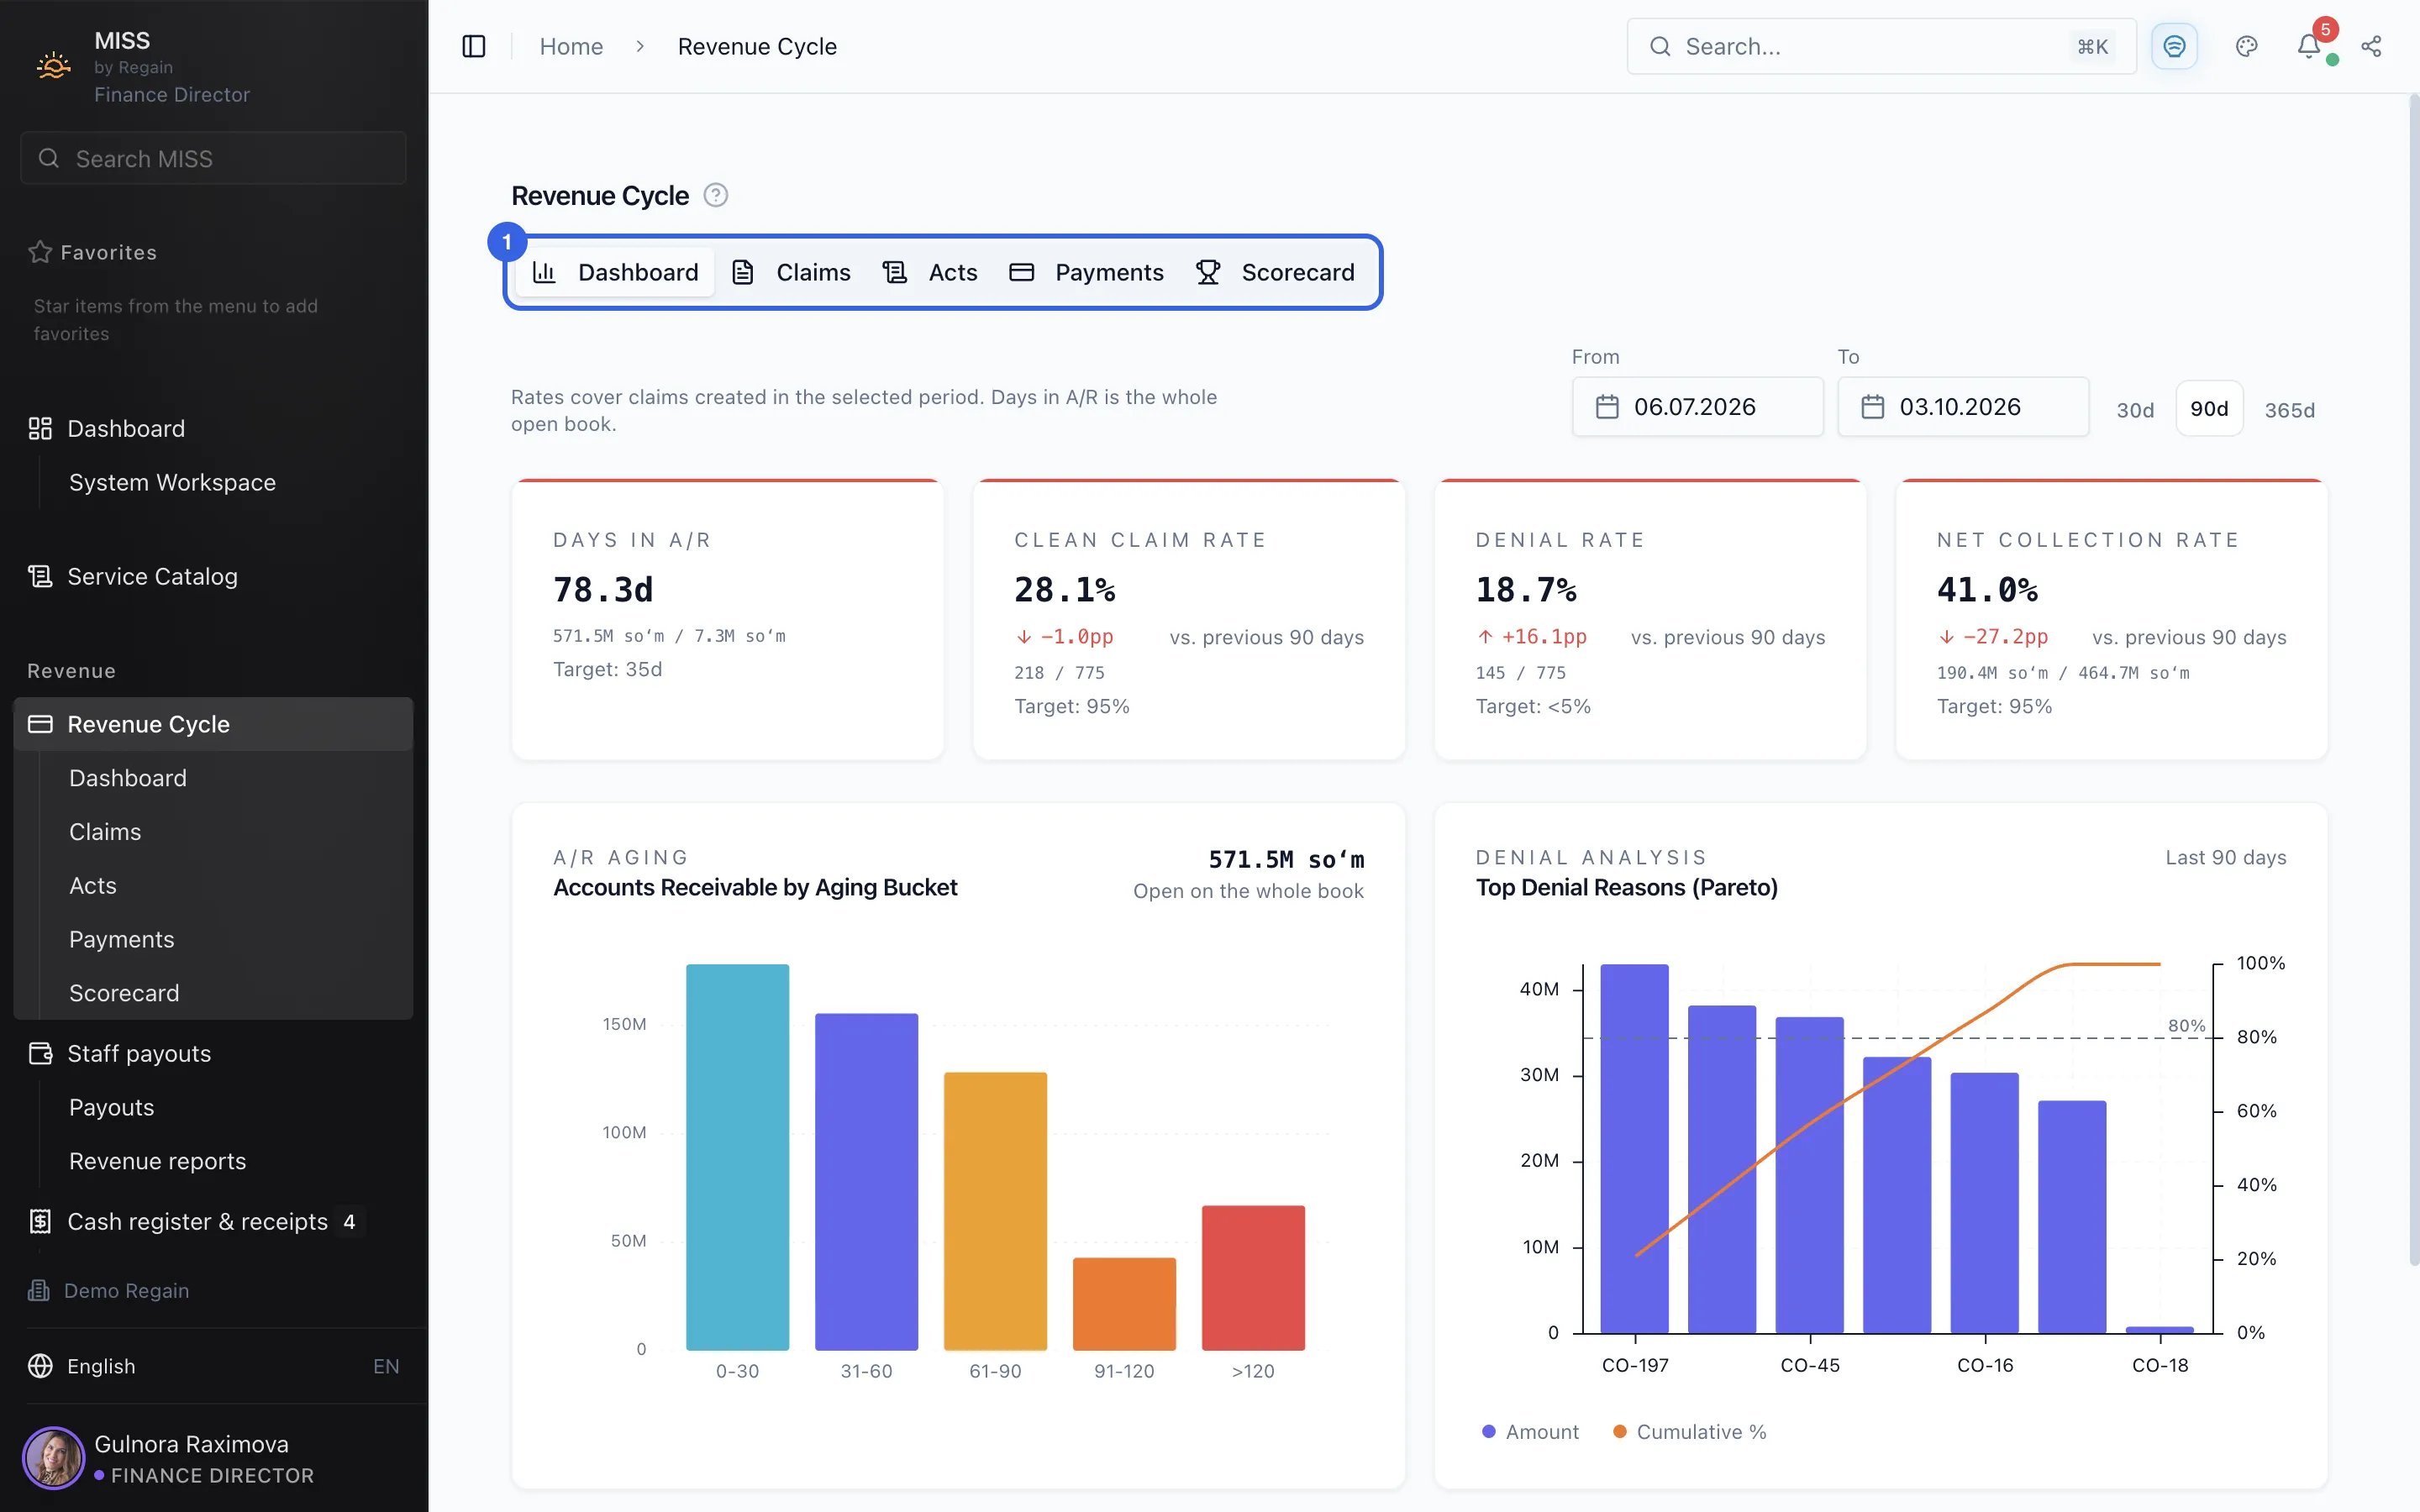
3 - At the top are the tabs Dashboard, Claims, Acts, Payments and Scorecard. Dashboard is open.
4
Screenshots captured on 2026-10-03